Analytics
How to read Analytics: revenue, appointment count, no-shows, top services, staff performance, most loyal clients and CSV export of appointments.

Analytics shows you on one screen how your business is doing: how much revenue your appointments bring in, how many appointments there were, how many clients didn't show up, which services earn the most and how each employee is performing. On this page you'll learn what each figure means, how it's calculated and how to export appointments to a CSV file for your accountant or a spreadsheet.
Before you start
- Only users with the Owner or Manager role can see Analytics. An employee with the Staff role has no Analytics item in the menu, and if they open the screen through a direct link, Appointa sends them back to the dashboard. Roles are assigned when you invite an employee — see Invitations and roles.
- Analytics is available on all plans, including the free Starter.
- The figures are built from the appointments in your calendar. The more accurate your appointment statuses (confirmed, completed, no-show), the more useful the reports.
Opening Analytics
- In the sidebar, click Analytics.
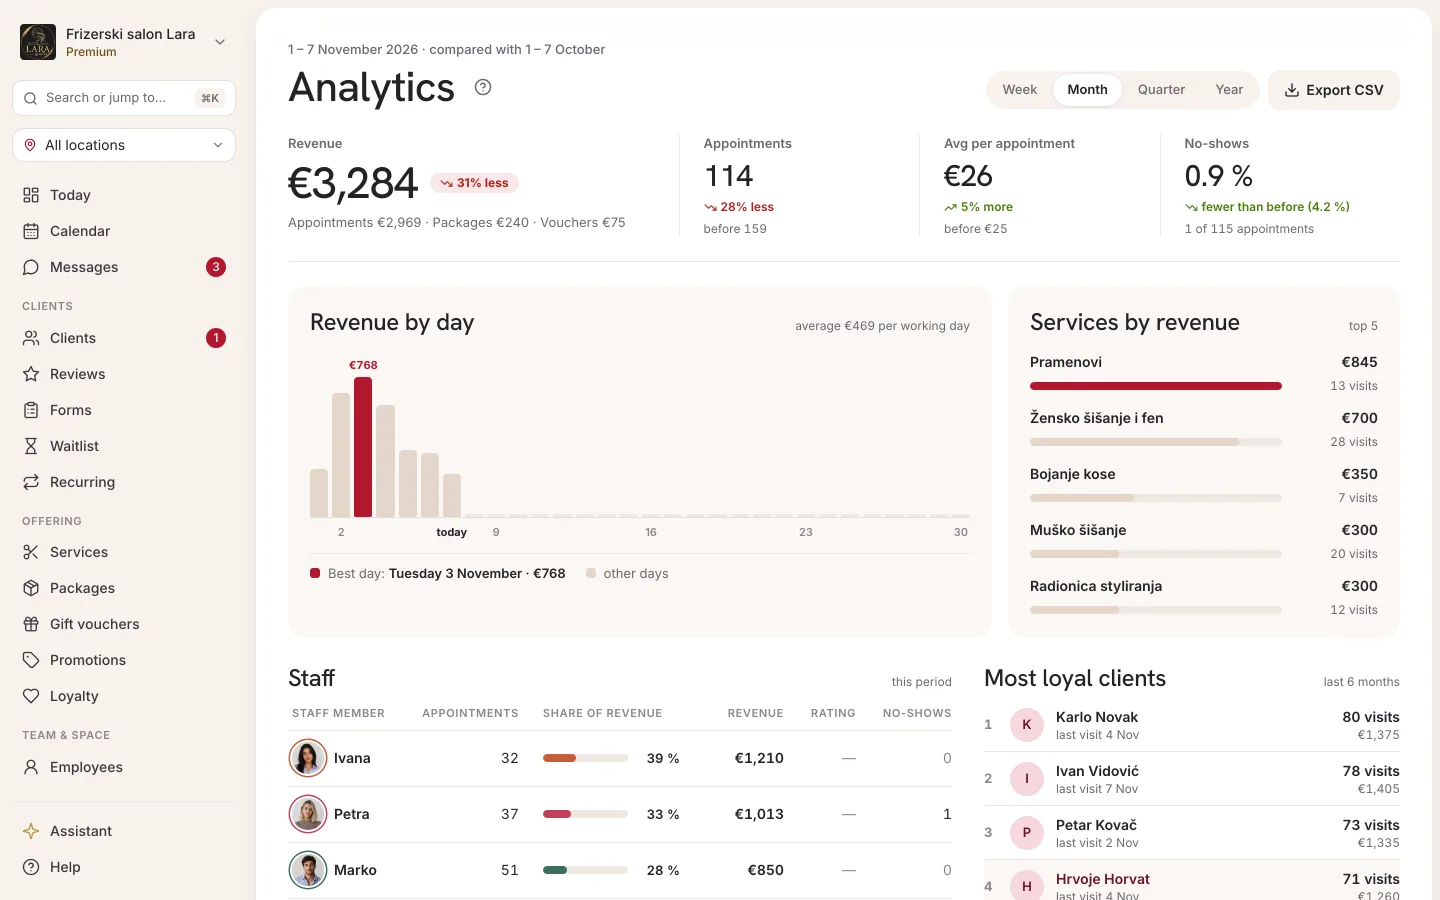
- A screen opens with the title Analytics and the subtitle “Revenue, appointments, and staff performance.” The Month period is selected by default.
- In the top right you'll find the period switcher and the Export CSV button.
Choosing a period and comparison
The switcher in the top right offers four periods. Each one is the current period — from start to end, including days that are still to come:
| Period | What it covers | How the revenue chart is grouped |
|---|---|---|
| Week | the current week, Monday to Sunday | by day |
| Month | the current calendar month (default) | by day |
| Quarter | the current quarter (e.g. July–September) | by week (weeks start on Monday) |
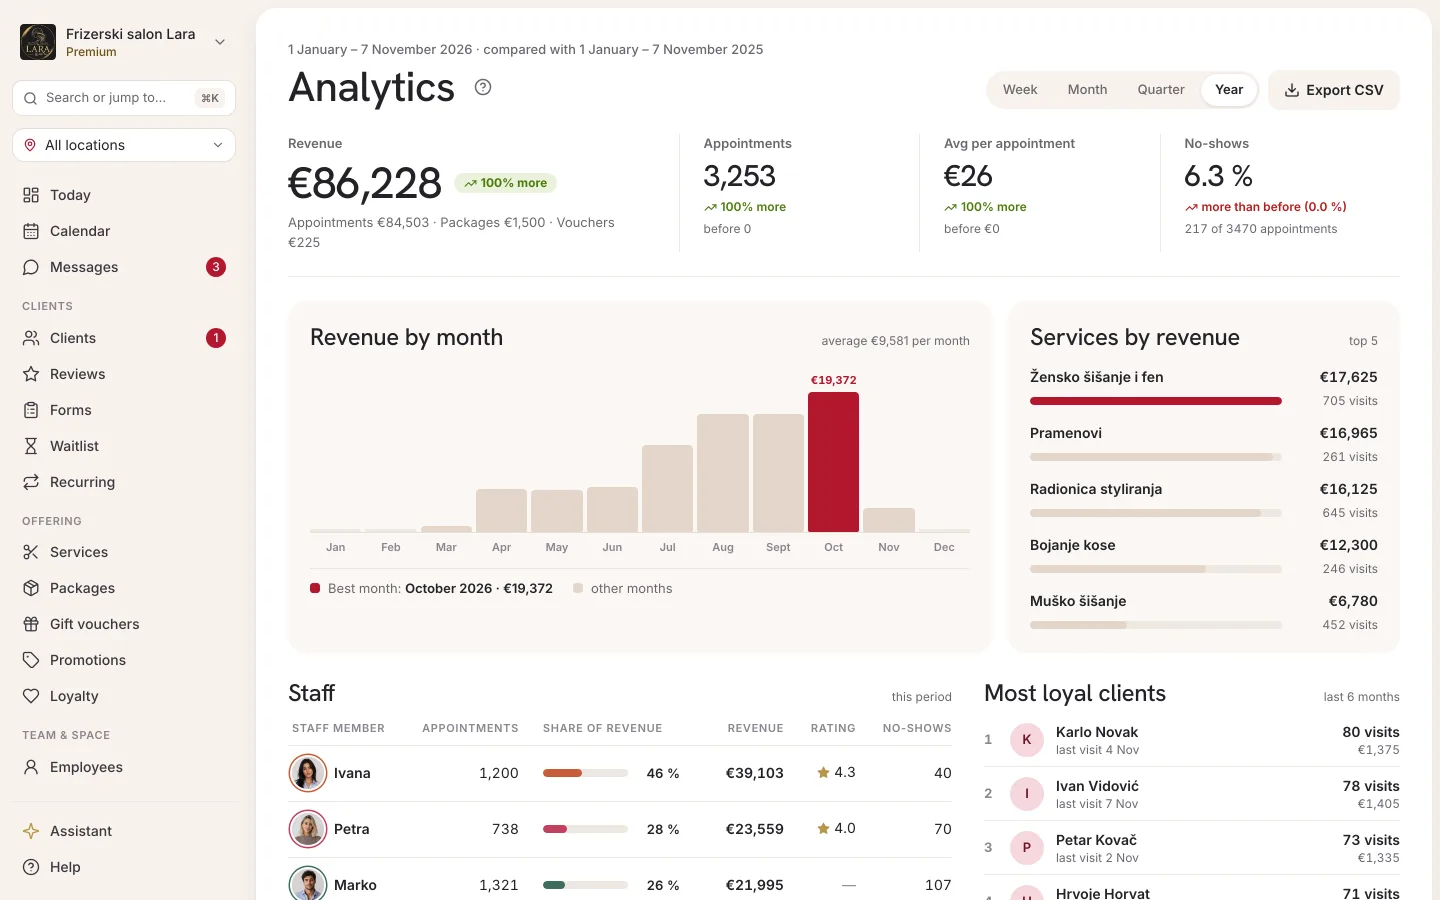
| Year | the current calendar year | by month |
When you change the period, all figures, charts and tables refresh. Your choice is kept in the page address, so you stay on the same period after reloading the page.
The figure cards compare the selected period with the previous period of the same length immediately before it (e.g. this month against the same number of days before it).
Key figures
There are four cards at the top:
| Card | What it shows | How it's calculated |
|---|---|---|
| Revenue | total revenue in the period, rounded to the whole euro | appointments with the status Confirmed and Completed (final price, less any part paid with a gift voucher), plus packages and gift vouchers sold in the period |
| Total appointments | the number of appointments in the period | counts only Confirmed and Completed appointments |
| Avg per appointment | the average price of one appointment, rounded to the whole euro | final appointment prices divided by the number of appointments; appointments taken from a package aren't counted |
| No-show rate | the percentage of no-shows, to one decimal place | the number of No-show appointments divided by the sum of appointments and no-shows |
What is not counted in Revenue and Total appointments:
- Pending appointments (until you confirm them),
- Cancelled appointments,
- No-show appointments — these are tracked only in the No-show rate card.
Revenue uses the final appointment price, i.e. after any promotion or loyalty program discount. How the final price is worked out is explained on the Price calculation page.
Revenue counts money when it comes in, and never twice:
- a package or membership counts towards Revenue at its price on the day it's sold; an appointment the client takes from a package has a price of €0 — it counts towards Total appointments but doesn't increase Revenue;
- a gift voucher counts towards Revenue on the day it's sold, at the voucher amount (a service voucher at the service price); when an appointment is paid with a voucher, that part isn't counted again, and whatever the client pays on top stays appointment revenue (Gift vouchers);
- a cancelled package or voucher doesn't count towards Revenue; an expired voucher does, because it was paid for.
When packages or vouchers were sold in the period, the Revenue card shows a breakdown, e.g. “Appointments €3,930 · Packages €300 · Vouchers €50”. Revenue per employee and the top services are still worked out from appointments only.
Trend next to the figure
Below the first three cards you'll see the percentage change labelled “vs previous period” and an arrow:
- green arrow up — the figure went up,
- red arrow down — the figure went down,
- dash (—) — no change, or no data in either period.
If there was nothing in the previous period and there is something now, you'll see “+100%”.
The No-show rate card has no trend percentage or arrow. Below it you'll see a ratio, e.g. “2 no-show out of 40”. The ratio is coloured according to the change from the previous period, but the opposite way from the other cards: fewer no-shows is good, so a drop is green and a rise is red.
Revenue chart
The large bar chart shows how revenue is spread across the period. The title, the bars and the average in the header depend on the period:
| Period | Chart title | Average in the header | Legend |
|---|---|---|---|
| Week, Month | Revenue by day | “avg €…/day” | weekday and Fri / Sat (gold bars) |
| Quarter | Revenue by week | “avg €…/wk” | weekly revenue |
| Year | Revenue by month | “avg €…/mo” | monthly revenue |
- Friday and Saturday are highlighted in a different colour because they are the busiest days for most businesses; all other days (including Sunday) are shown as “weekday”.
- The average is calculated only over the days (weeks, months) that had revenue — days without revenue don't pull the average down.
- When you hover over a bar, you see the date (or the week range, or the month) and the exact amount. When there's room, the amount is also shown on or above the bar itself; on bars that are too narrow you only see it on hover.
- If the bars don't fit the width of the card (e.g. 31 days on a narrow phone screen), the chart scrolls horizontally inside the card.
- If there's no revenue in the period, you'll see “No revenue this period.” instead of the chart.
Top 5 services
The Top 5 services panel (labelled “by revenue”) ranks up to five services that brought in the most revenue in the period. For each one you see:
- the service name,
- a bar whose length shows its revenue relative to the top service, with the number of appointments (e.g. “18 appointments”),
- the service's total revenue.
Only Confirmed and Completed appointments are counted. With no data, the panel shows “No services.”
Staff performance
The Staff performance table (labelled “this period”) lists every employee who had at least one appointment in the period, sorted by revenue.
| Column | Meaning |
|---|---|
| Name | the employee, with a photo or initials |
| Appointments | the number of Confirmed and Completed appointments |
| Revenue | the sum of the final prices of those appointments |
| Avg rating | the average rating from client reviews for appointments in the period, to one decimal place (e.g. ★ 4.8); a dash if there are no ratings yet |
| No-show | the number of that employee's appointments the client didn't show up for |
An employee whose appointments in the period are all pending, cancelled or no-shows also appears in the table, with 0 appointments and €0 revenue. If nobody had an appointment, you'll see “No appointments for staff.”
Ratings come from the reviews clients leave after their appointments — more on the Reviews page.
Most loyal clients
The Most loyal clients panel (labelled “top 5 · 6 months”) shows the five clients with the most appointments in the last six months. Only Confirmed and Completed appointments are counted, and when two clients have the same number of appointments, the one who spent more comes first. If there are no such appointments in that period, you'll see “No data.”
For each client you see their rank, name, the date of their last appointment (“last visit: …”), the number of appointments and their total spend. Clicking a row opens the client profile.
Exporting to CSV
The Export CSV button downloads a list of all appointments in the selected period as a CSV file, which you can open in Excel or Google Sheets or send to your accountant.
- Choose the period (Week, Month, Quarter or Year).
- Click Export CSV.
- Your browser opens a new tab and downloads the file.
Unlike the screen, the CSV contains appointments of every status, including cancellations and no-shows. Each row is one appointment:
| Column | Contents |
|---|---|
date |
the appointment date (year-month-day), in your business's local time |
time |
the appointment start time (hours:minutes), in your business's local time, the same as in the calendar |
status |
the appointment status: pending (Pending), confirmed (Confirmed), completed (Completed), cancelled (Cancelled), no_show (No-show) |
service |
the service name |
employee |
the employee |
client |
the client |
price_cents |
the final price in cents (e.g. 2500 = €25.00) |
Analytics in the Appointa Pro app
The owner and managers can also check the key figures on their phone: in the Appointa Pro app, tap the More tab in the bottom bar, then Analytics. More on the Appointa Pro page. CSV export is available on the web.
Frequently asked questions
Why doesn't the revenue match my till?
Analytics adds up the prices of confirmed and completed appointments, including those still to come in the current period, plus the packages and gift vouchers you sold. It doesn't include pending, cancelled or no-show appointments. Your till records actual payments, so the figures can differ — e.g. an appointment still to come is already in Revenue, but you'll charge for it when the client comes in. What you actually took is in the book of receipts (see Invoice exports).
Why is the trend red at the start of the month?
The current month isn't over yet, and it's being compared with the whole previous period. In the first days of the month the figures are usually lower, so the trend is negative. You get a true picture by comparing towards the end of the period.
Why does an employee have no rating?
The average rating is shown only when there are reviews for that employee's appointments in the selected period. Without reviews, you'll see a dash.
Why doesn't “Most loyal clients” change when I change the period?
That panel always looks at the last six months, regardless of the selected period.
Can an employee see their own figures?
Not on this screen — Analytics is available only to the owner and managers. If you want someone to see the reports, give them the Manager role.
The screen says “Failed to load.”
Click Try again. If the message keeps coming back, reload the page or contact support.